In this article I will try to describe concept of Big Data and will also describe how ETL process handle High-Volume Data. I will also describe how the traditional ETL works with Big Data.
Background
To understand Big Data and its analysis I will cover some important parts:
- What is Big Data?
- Source of Big Data
- How to understand the data is Big Data?
- Why a processing needs to be done in given time frame?
- What is ETL?
- Extract
- Transform
- Load
- Real world example of typical ETL
- Staging Tables
- Dimension Tables
- Fact Tables
- Aggregate tables
- View Table
- Report Table
- Which others facility ETL can provide you?
What is Big Data ?
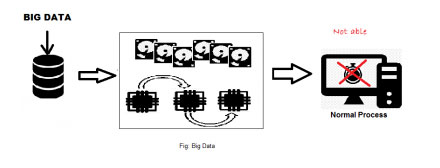
Big data refers to huge volume of data which cannot be stored and processed in traditional approach within the given time frame.
Source of High-Velocity Data
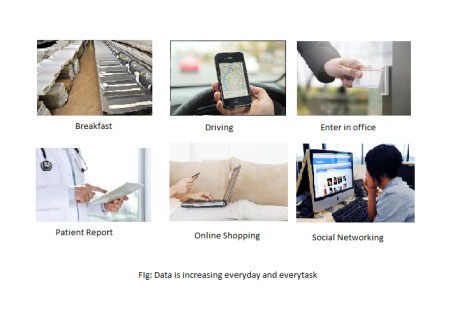
We are increasing data everyday in our every work. Everyday Massive Data is consisting of billions to trillions of records of millions of people—all from different sources (e.g. Web, sales, customer contact center, social media, mobile data and so on). The data is typically loosely structured data that is often incomplete and inaccessible.
How to understand the data is Massive or Complex Data?
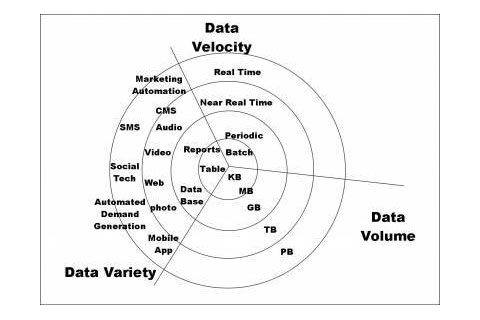
If the data below properties, we can say the data as Big Data.
- Volume (amount of data) – Volume describes the amount of data generated by organizations or individuals. High-Velocity Data is usually associated with this characteristic.
- Velocity (speed of data in and out)- Velocity describes the frequency at which data is generated, captured and shared.
- Variety (range of data types and sources) – Big data means much more than rows and columns. It means unstructured text, video, audio that can have important impacts on company decisions – if it’s analyzed properly in time
Why a processing needs to be done in given time frame?
In the real world we are increasing big amount of data everyday. If you consider only social networking site like Facebook, twitter, YouTube, google+ etc are taking huge amount of data everyday. It has published that Facebook processes more than 500 TB of data daily.
Where twitter gets 700 Million tweets each day, Linked-in and google plus also gets like 20 TB of data everyday. And finally YouTube, it has been reported that each minute 500 hours fresh video uploaded.As the user is increasing day by day the storing and processing becomes a challenging task. So you are thinking why the process need to be finished in a given time frame? Lets see the below figure and try to understand-
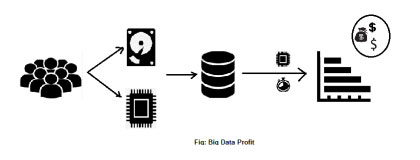
Yes, Profit!!! Since the data holds a lot of valuable information, this data needs to be process in a short span of time by using this valuable information make boost the sales and increase more revenue.
So, What is the solution? As the traditional system is not able to stored and processed the data, in that case ETL comes to the picture:
What is ETL?
ETL stands as Extract,Transform and Load.
Extract: Extract means “Just dump from different source to staging”. In ETL the extract works as bring the data feed. Data feed is the source of data. Those data feed may come from SAP or any Software. The data feeds may csv/txt/excel.
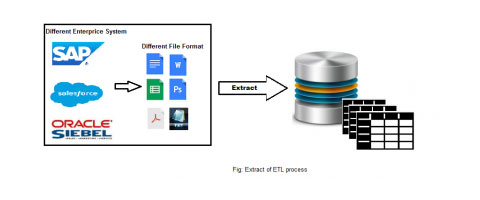
In this step process bring those feed to database and load as it is. In Extract step process not check any validation.
Transform: After Extracting it will go to Transform stage. In this stage it will make appropriate transformation.
In ETL, In the transformation phase, the data is processed to make values and structure consistent across all data. In this state several action happens:
- Date formatting (for example database takes “MM-dd-YYYY” and your source contains “dd/MM/YYYY”). So, it will convert the appropriate format.
- Phone numbers formatting (for example database takes “xxx-xxx-xxx” formatted but source contains “xxxxxxx”, then it will make appropriate format)
- Address validations, convert them into proper naming, e.g. Street/St/St./Str./Str
- Joining Lookup, metadata with multiple source file,Transposing rows and columns,Different type of data validation
- And all kind of validation
The transformation also happens from several sources with joining different table, generating aggregates, generating surrogate keys, sorting, deriving new calculated values, and applying advanced validation rules.
Totally, the goal of transformation is to make all the data conform to a uniform schema.
Load: In this stage data is ready to load in source to target database. While transform stage is done the process start to loading the data into a data warehouse or data repository other reporting applications.
Real world example of typical ETL?
Most of the typical ETL follows below type tables:
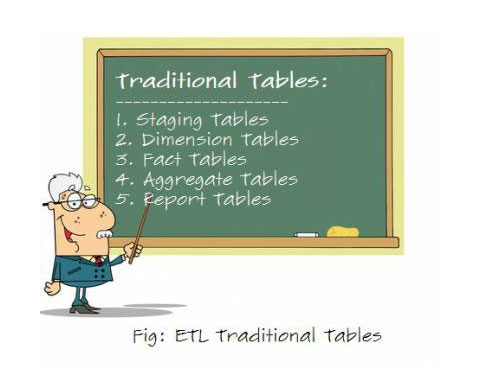
Staging Tables: This is the first step of ETL process. In this stage, ETL will just dump data from different source to staging tables.
Dimension Tables: This stage takes value from staging tables. There are many types of dimensions like territory, time, customer, buyer etc. Sometimes the dimension becomes two types like external dimension and internal dimension.
Fact Tables: Fact tables will also have metrics and foreign key references to all associated dimensions. The metrics should only be those necessary to represent the type of fact and should eliminate redundancy or derived calculations where applicable (for example, we can persist total sales and quantity, which aggregate normally, and between those can derive a calculation for price/quantity which thus need not be stored in the table itself as it can be determined later as necessary).
Any fact records that don’t meet the designated business logic (by not having valid dimension values or meeting specific metric constraints) are persisted in a separate quarantine table. The constraints for quarantine are described in the data feed specific entries in the Data Feed Dictionary or Dimension Population Rules Matrix attachments.
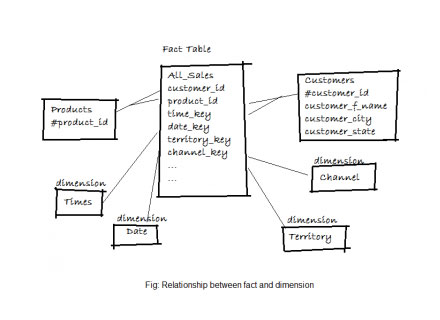
The fact table shows the first one category which is combination of all dimension tables.
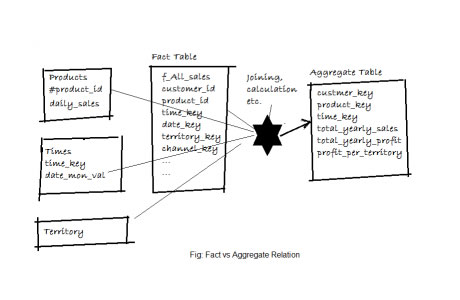
Aggregate tables: Aggregate tables are summary tables which contains the summary information say for eg: total sales revenue (for a quarter). So the difference between fact and aggregate is in the granularity.Fact tables store date in more detail level, but in aggregate tables the granularity is high.
Please take a look to look the relation between Fact and Aggregate table:
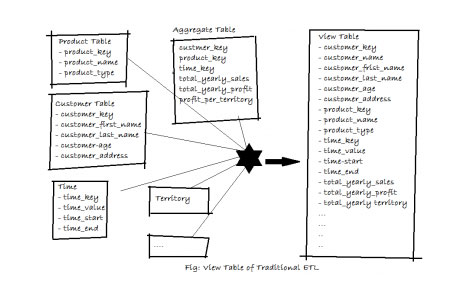
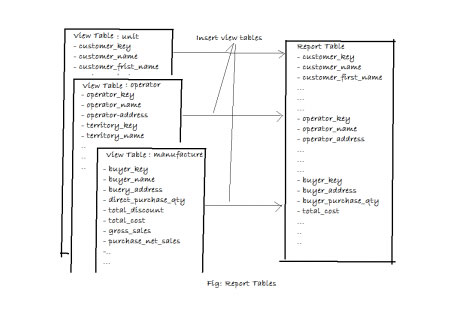
View Table: View table is combination of all target outputs. It contains each and every targeted columns which will go to BIQ-Dashboard. As aggregate contains the foreign keys and summery, it will join all the related tables and pick the target columns. Please look the view table concepts:
Report Tables: Report table is combination of all view table and this table will ready to transfer data to BIQ-Dashboard. It will contains all the columns which needs for BIQ-Dashboard.
Please take a look of a report table below:
Finish !! Your ETL is done and report data is ready to go in BIQ-Dashboard.
Which others facility ETL can provide you?
Let’s a quick look what type of facility ETL can provide you:
Data Connectivity: ETL process should communicate with any source of data. No matter where comes from data. This is critical task.
Performance: Moving and changing data can require is serious processing power. So, it’s important that your ETL tool can scale your future data growth
Transformation Flexibility: Matching, merging and changing data is critical. ETL tool should allow this and many other package transformation to simple drug and drop movement
Data Quality: Your data is clean. I can guarantee it. YOu will need support in data profiling and data quality including the ability to valid data addresses.
Flexible Data Acquisition Options: Once you have ETL development environment, you want the flexibility to wither your data is required or time interval based on the trigger. That means you wants the flexible so you can informed what data get pulled like this is old data or any specific subset of data.
What is next ?
I will analysis about BIQ-Dashboard in part-2. Thanks!
Feel free to leave any comments for clarification, changes, or improvements. Also, you can contact with iXora Solution expert teams for any consultation or coordination from here.
Add a Comment